
I wanted to install Elastic Security to use in my home lab machine. I have used Helk and Security Onion in the past. I found some walkthroughs on how to do this but had some trouble following them to get this to work. This is my documentation on how I installed it.
My home lab is an Intel Nuk running Windows 10 and VMware Workstation 6 with 32 GB ram and two 1TB Samsung 970 EVO SSD drives. The virtual machines consist of a Windows 2019 Domain controller and a couple of Windows 10 workstations. I run Kali from my Surface Book 3 so I can practice stuff anywhere.

I created a new machine and installed Ubuntu Server 20.04 using a static IP address. This is standard stuff so I will not document that part. This from my OneNote notes I take while I am doing stuff. If you do not understand the steps read the blog I linked at the bottom of this page. My steps are the cliff notes version of his post with all the commands and screenshots to make it easier for me to redo the machine again. I could not have figured this out if it was not for his work. These are the exact steps that worked in the end for me after about 5 tries because of things I did wrong like installing elastic as root.
Installing Elasticsearch, Kibana and Filebeat
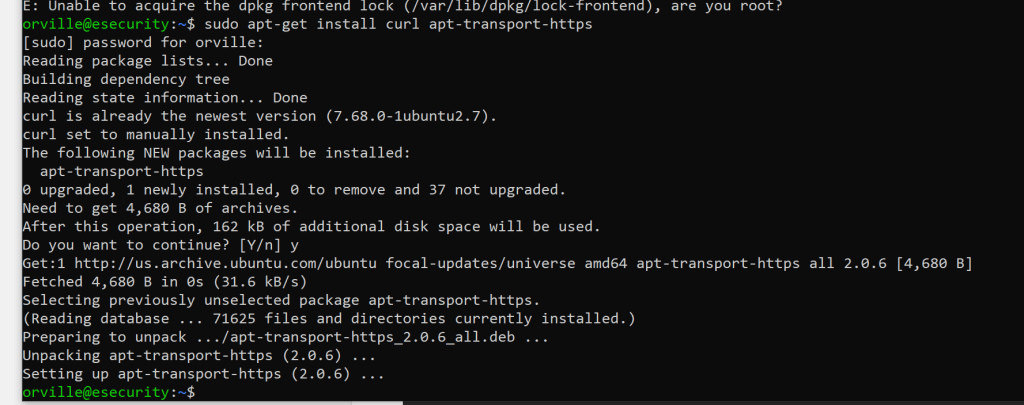
sudo apt-get install curl apt-transport-https
sudo curl -s https://artifacts.elastic.co/GPG-KEY-elasticsearch | apt-key add –

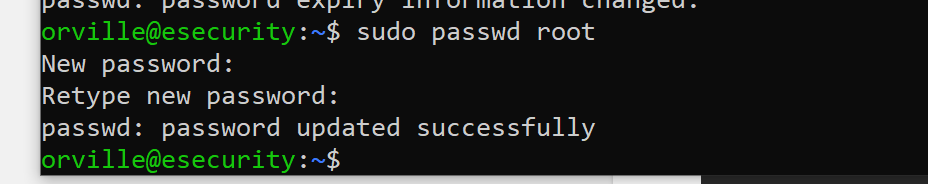
sudo passwd root
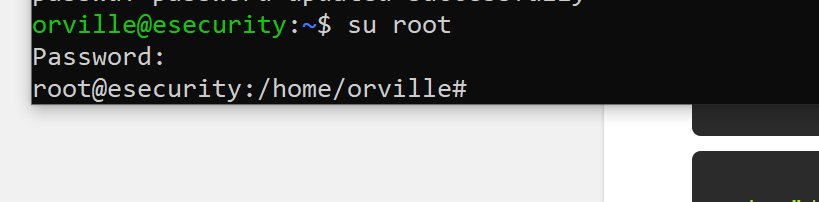
su root
sudo curl -s https://artifacts.elastic.co/GPG-KEY-elasticsearch | apt-key add –

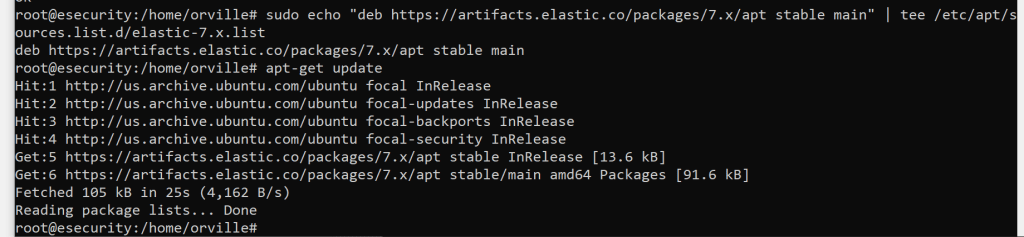
sudo echo “deb https://artifacts.elastic.co/packages/7.x/apt stable main” | tee /etc/apt/sources.list.d/elastic-7.x.list

apt-get update
switch back to the none root user before install Elastic
exit
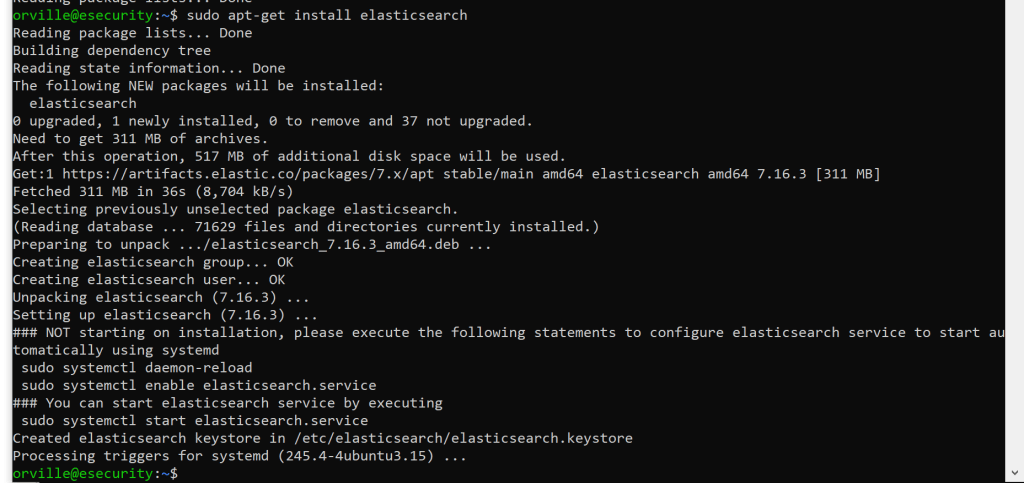
sudo apt-get install elasticsearch
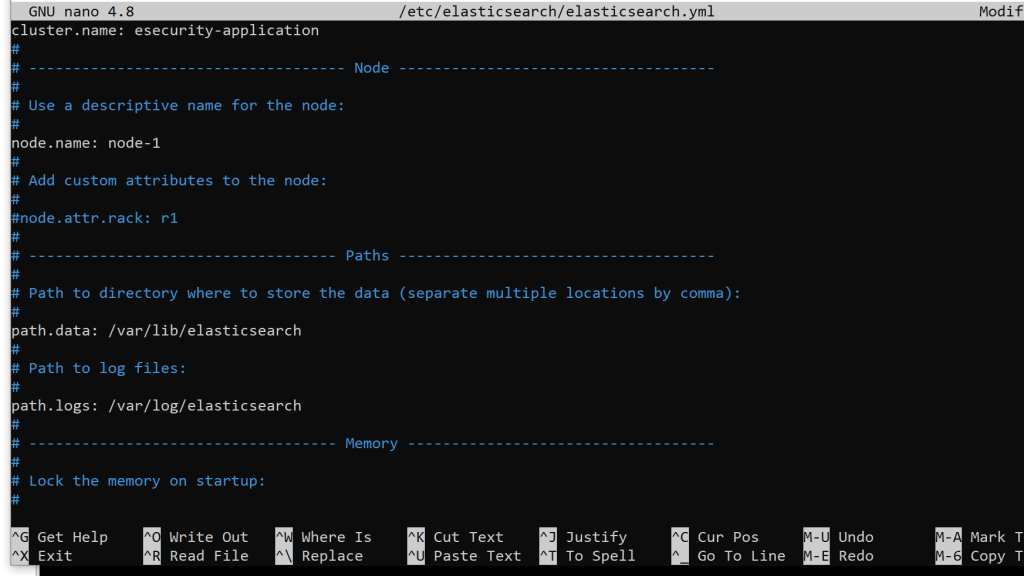
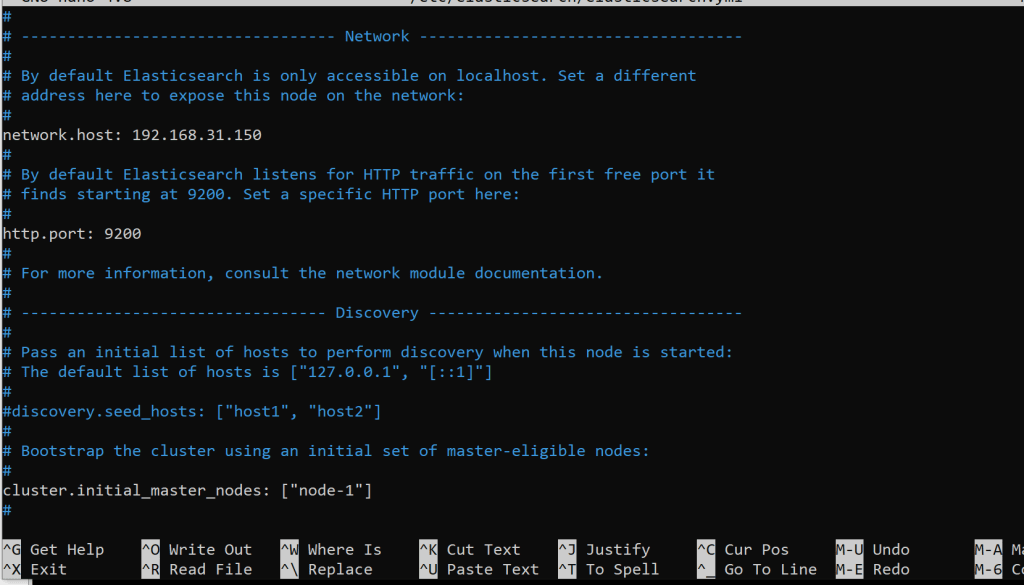
sudo nano /etc/elasticsearch/elasticsearch.yml
I made these changes
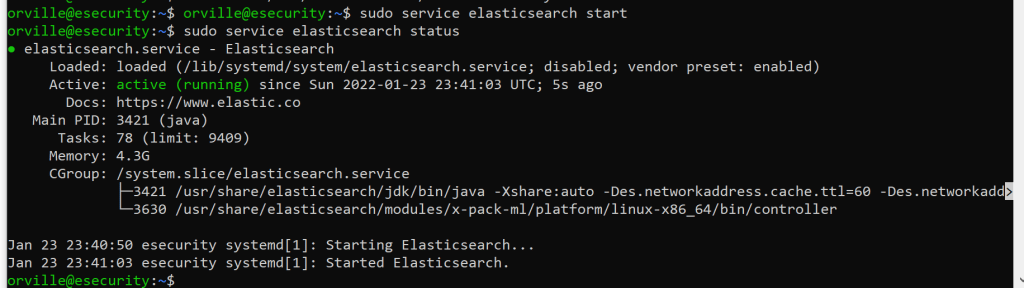
sudo service elasticsearch start
sudo service elasticsearch status
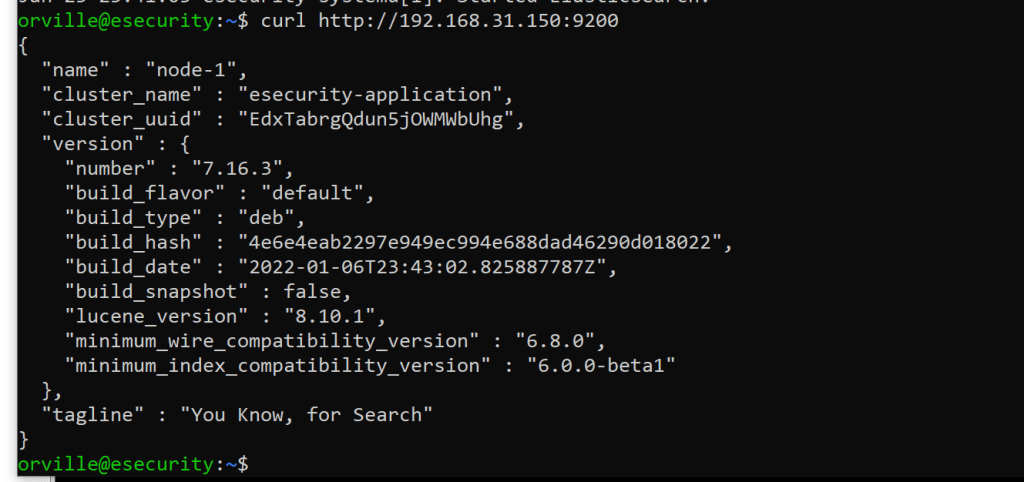
curl http://192.168.31.150:9200
take a snapshot
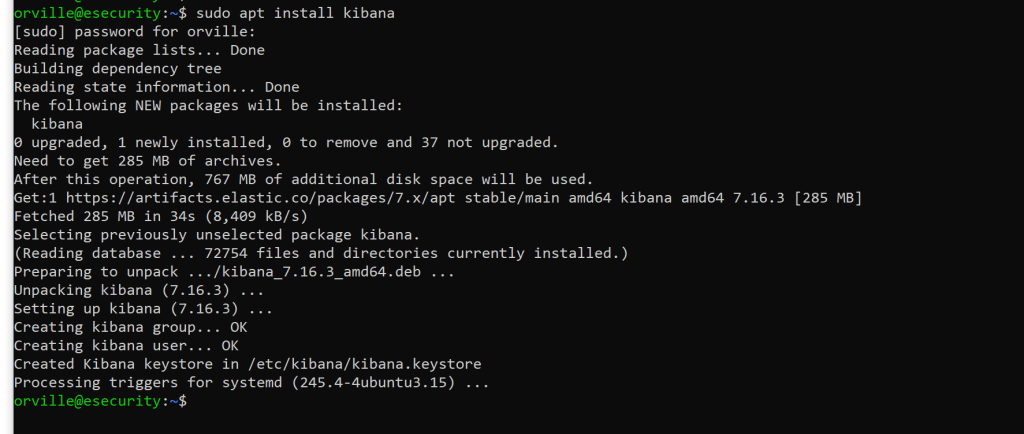
sudo apt-get install kibana
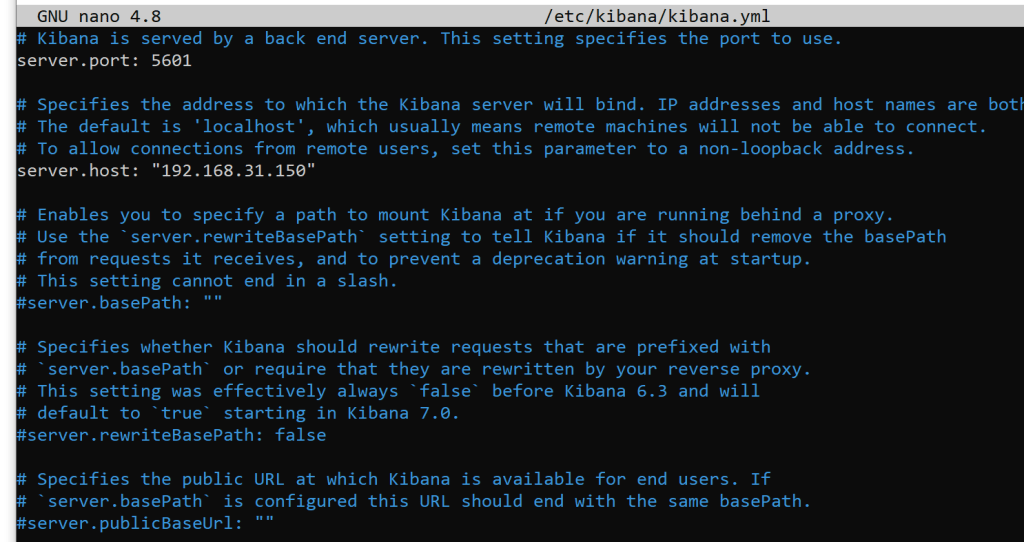
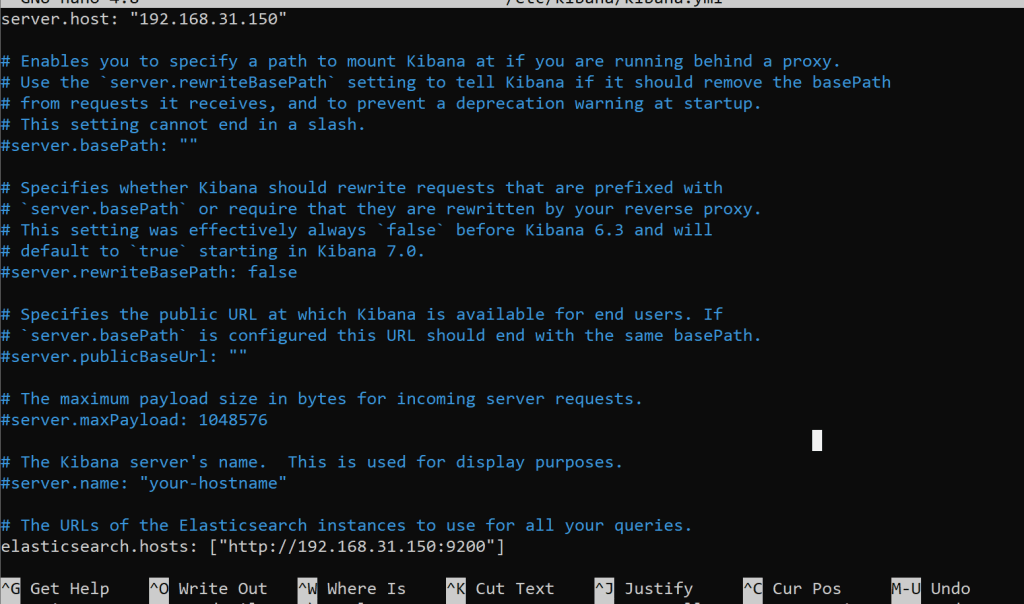
sudo nano /etc/kibana/kibana.yml
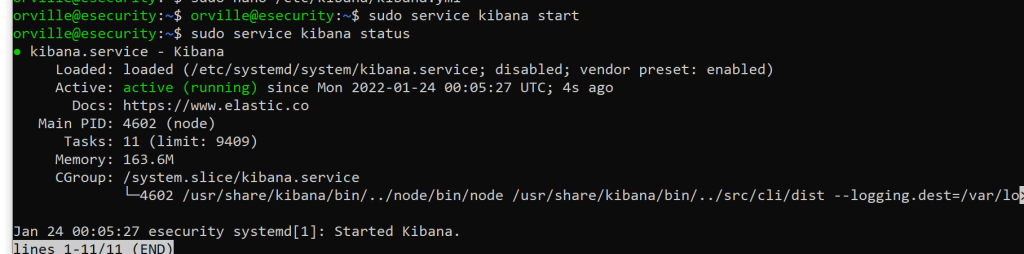
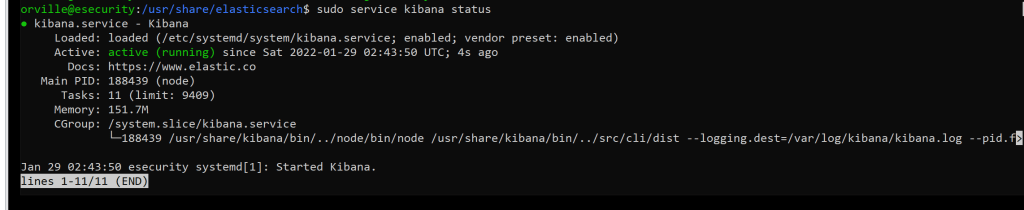
sudo service kibana start
sudo service kibana status
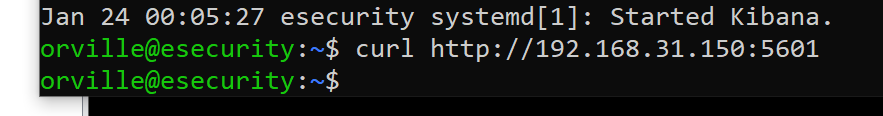
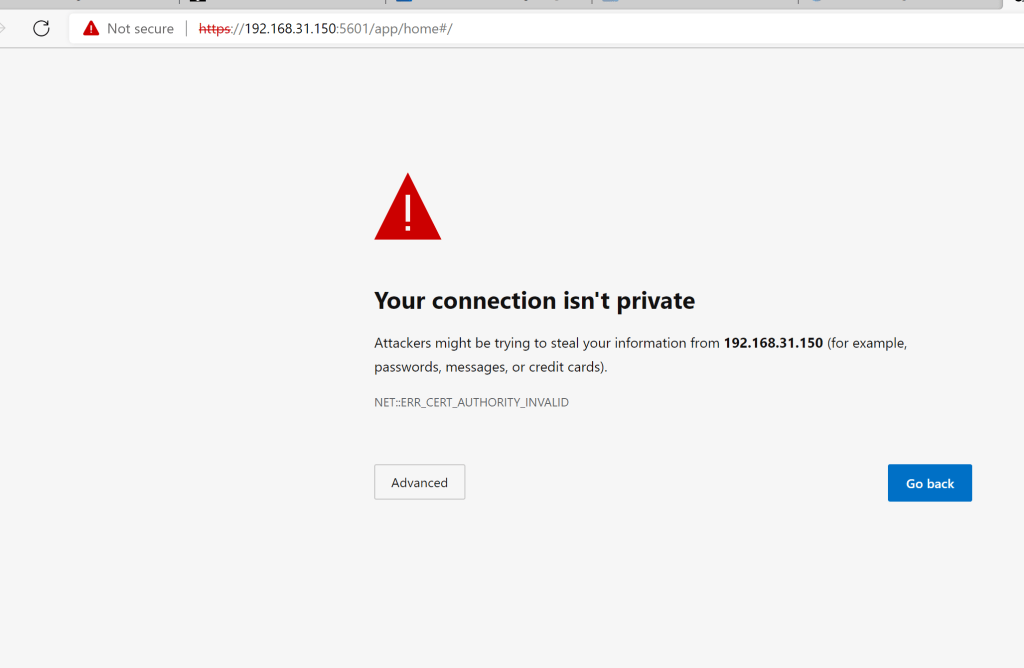
curl http://192.168.31.150:5601
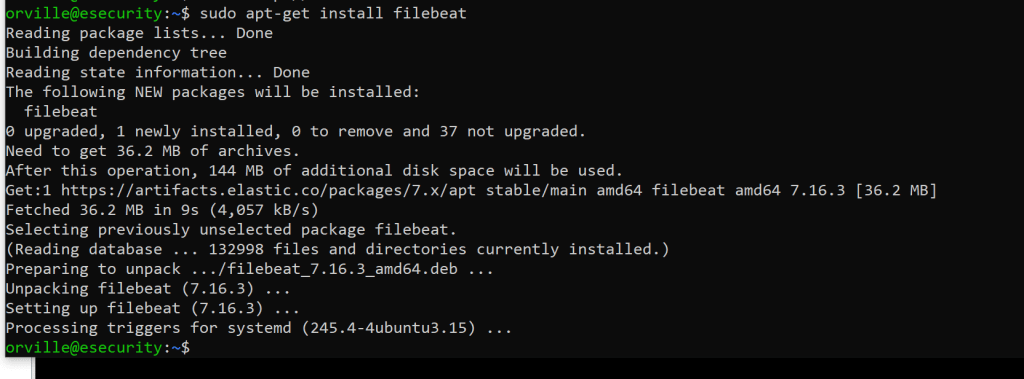
sudo apt-get install filebeat
sudo systemctl enable elasticsearch
sudo systemctl enable kibana
sudo systemctl enable filebeat

Create the certificates and directories
cd to /usr/share/elasticsearch
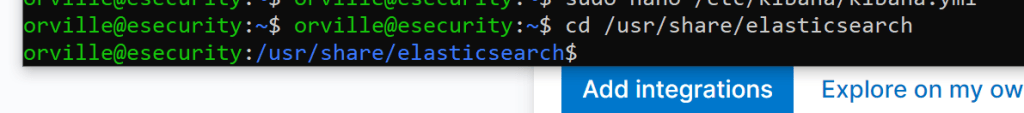
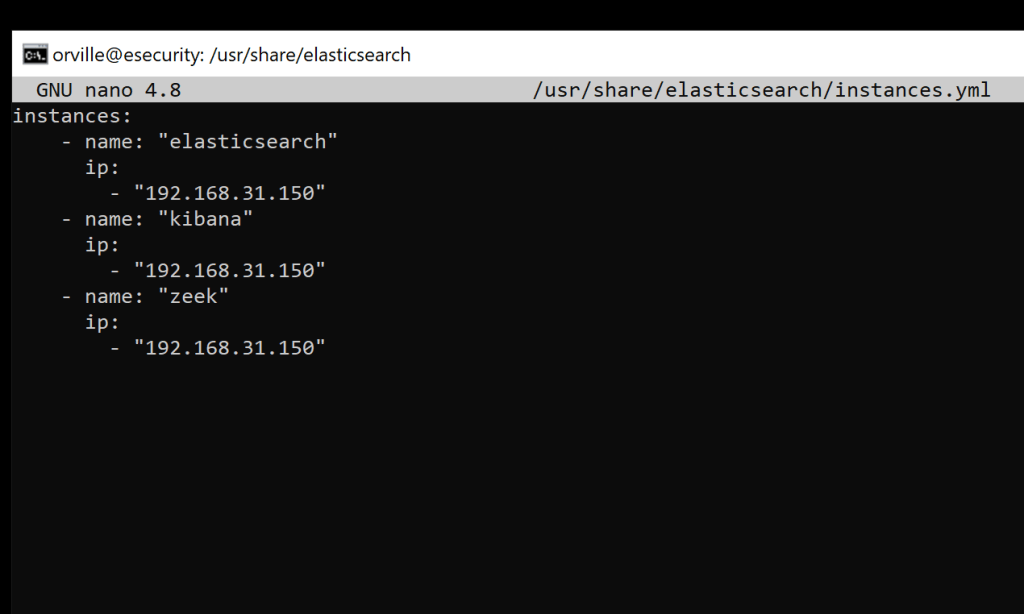
sudo nano /usr/share/elasticsearch/instances.yml
instances:
– name: “elasticsearch”
ip:
– “192.168.31.150”
– name: “kibana”
ip:
– “192.168.31.150”
– name: “zeek”
ip:
– “192.168.31.150”

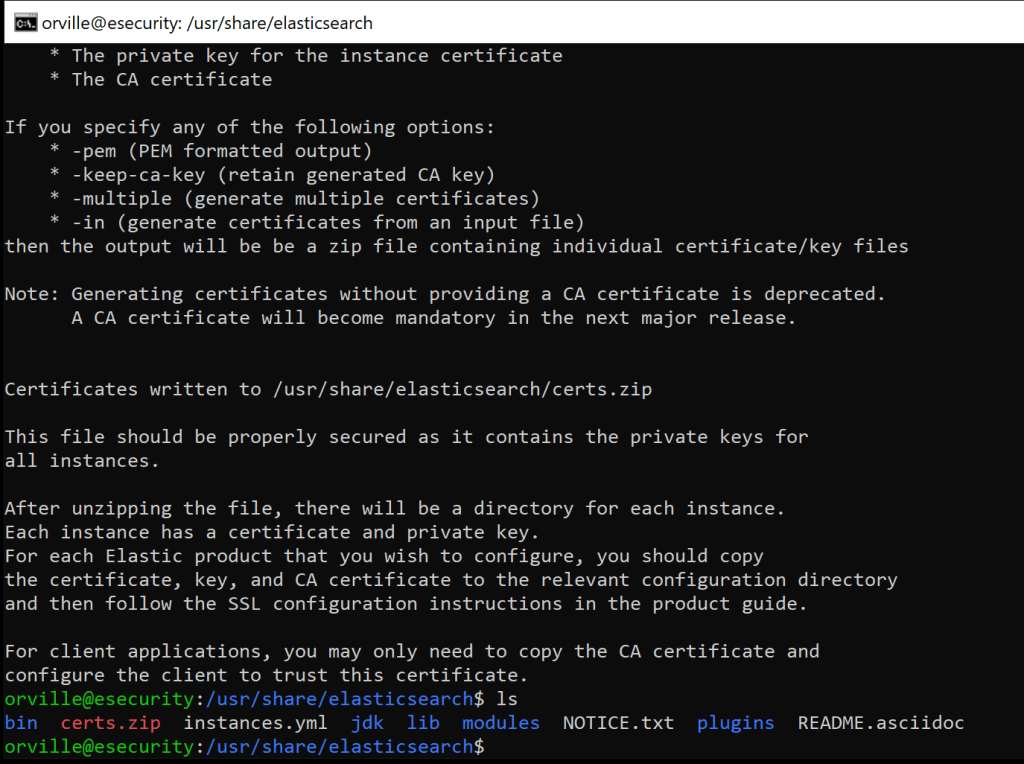
sudo /usr/share/elasticsearch/bin/elasticsearch-certutil cert ca –pem –in instances.yml –out certs.zip
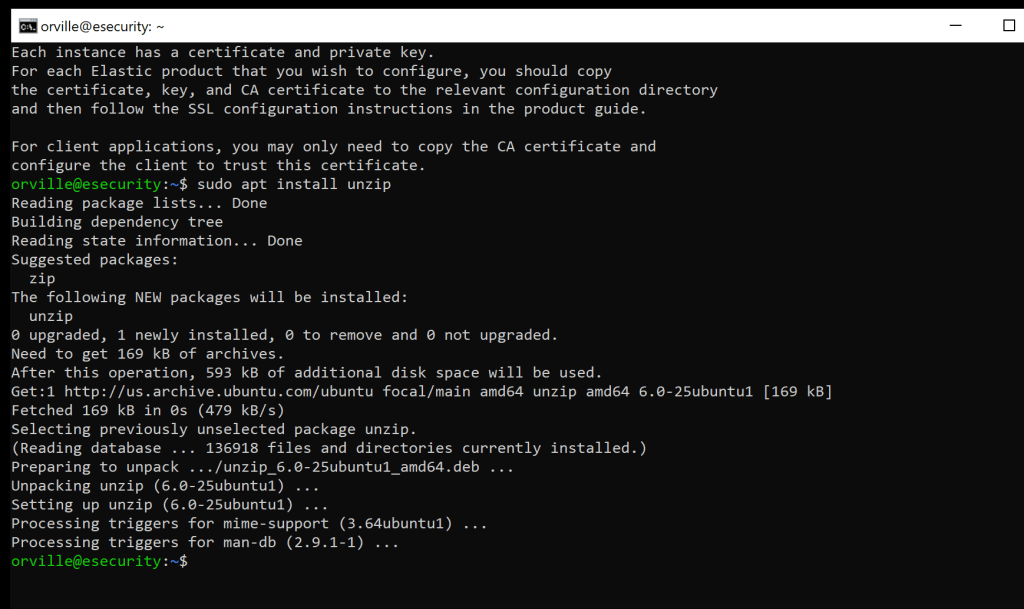
sudo apt install unzip
sudo unzip /usr/share/elasticsearch/certs.zip -d /usr/share/elasticsearch/

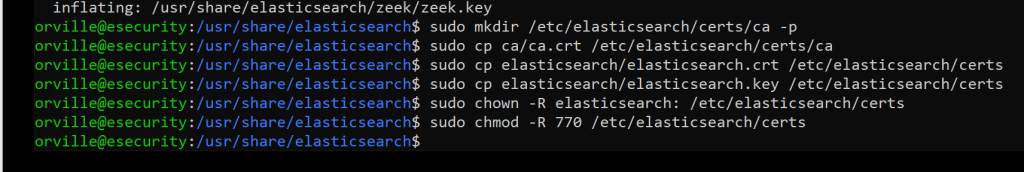
sudo mkdir /etc/elasticsearch/certs/ca -p

sudo locate elasticsearch
sudo cp ca/ca.crt /etc/elasticsearch/certs/ca
sudo cp elasticsearch/elasticsearch.crt /etc/elasticsearch/certs
sudo cp elasticsearch/elasticsearch.key /etc/elasticsearch/certs
sudo chown -R elasticsearch: /etc/elasticsearch/certs
sudo chmod -R 770 /etc/elasticsearch/certs
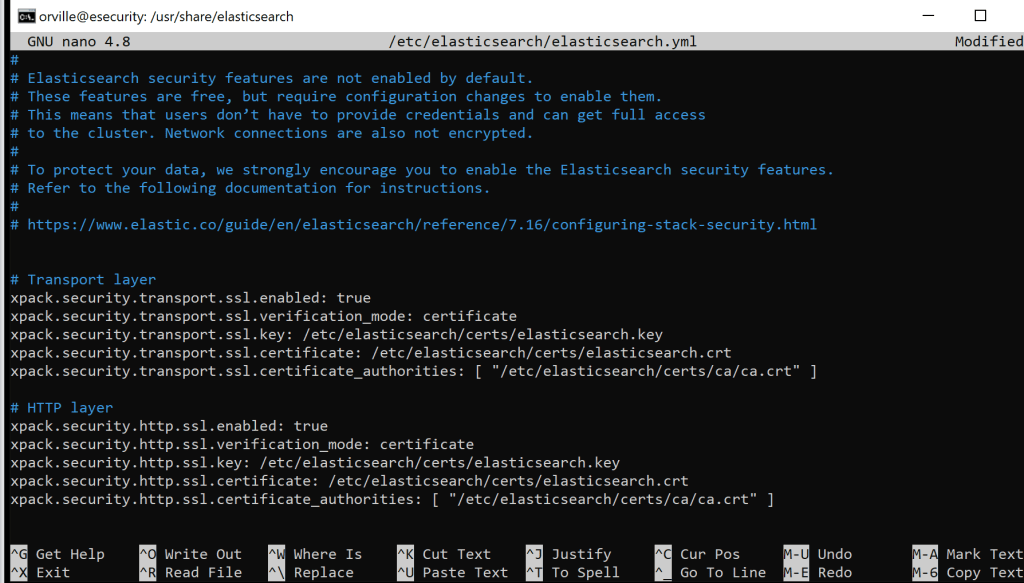
sudo nano /etc/elasticsearch/elasticsearch.yml
# Transport layer
xpack.security.transport.ssl.enabled: true
xpack.security.transport.ssl.verification_mode: certificate
xpack.security.transport.ssl.key: /etc/elasticsearch/certs/elasticsearch.key
xpack.security.transport.ssl.certificate: /etc/elasticsearch/certs/elasticsearch.crt
xpack.security.transport.ssl.certificate_authorities: [ “/etc/elasticsearch/certs/ca/ca.crt” ]
# HTTP layer
xpack.security.http.ssl.enabled: true
xpack.security.http.ssl.verification_mode: certificate
xpack.security.http.ssl.key: /etc/elasticsearch/certs/elasticsearch.key
xpack.security.http.ssl.certificate: /etc/elasticsearch/certs/elasticsearch.crt
xpack.security.http.ssl.certificate_authorities: [ “/etc/elasticsearch/certs/ca/ca.crt” ]
use right-click into the ssh nano terminal to paste this
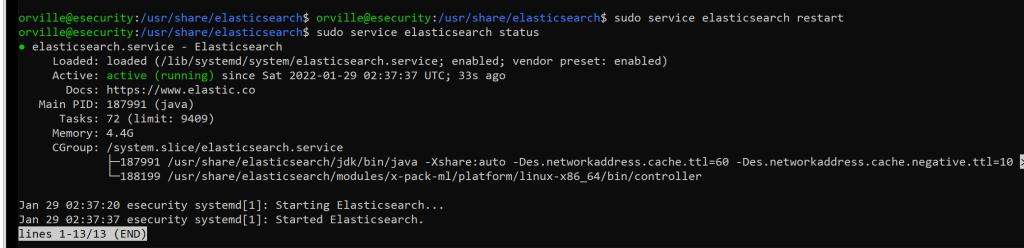
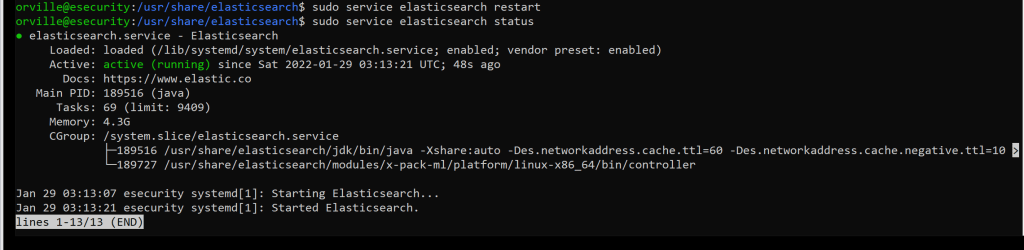
sudo service elasticsearch restart
sudo service elasticsearch status
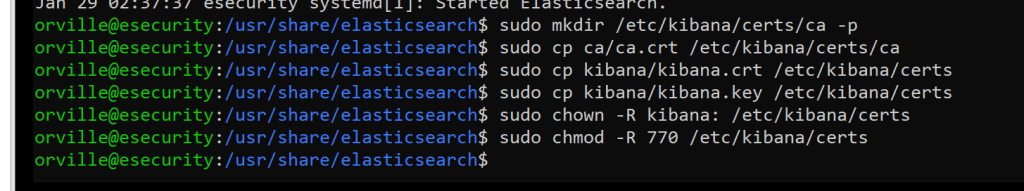
sudo mkdir /etc/kibana/certs/ca -p
sudo cp ca/ca.crt /etc/kibana/certs/ca
sudo cp kibana/kibana.crt /etc/kibana/certs
sudo cp kibana/kibana.key /etc/kibana/certs
sudo chown -R kibana: /etc/kibana/certs
sudo chmod -R 770 /etc/kibana/certs
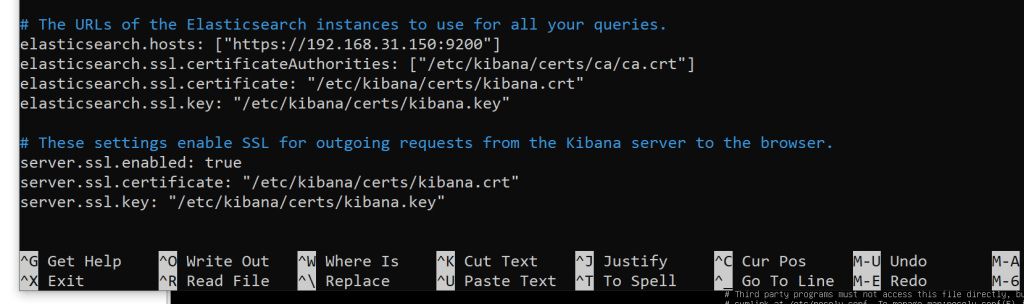
sudo nano /etc/kibana/kibana.yml
# The URLs of the Elasticsearch instances to use for all your queries.
elasticsearch.hosts: [“https://192.168.31.150:9200“]
elasticsearch.ssl.certificateAuthorities: [“/etc/kibana/certs/ca/ca.crt”]
elasticsearch.ssl.certificate: “/etc/kibana/certs/kibana.crt”
elasticsearch.ssl.key: “/etc/kibana/certs/kibana.key”
# These settings enable SSL for outgoing requests from the Kibana server to the browser.
server.ssl.enabled: true
server.ssl.certificate: “/etc/kibana/certs/kibana.crt”
server.ssl.key: “/etc/kibana/certs/kibana.key”
Note: Make sure that the elasticsearch.hosts line is commented out towards the top
sudo service kibana restart
sudo service kibana status
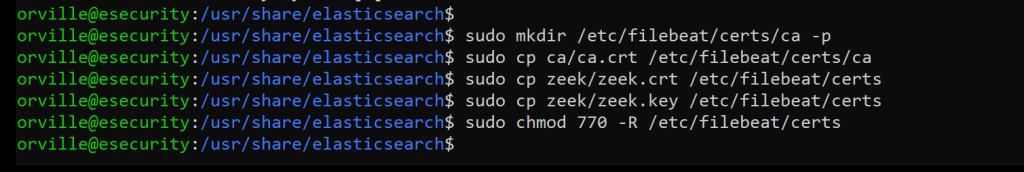
sudo mkdir /etc/filebeat/certs/ca -p
sudo cp ca/ca.crt /etc/filebeat/certs/ca
sudo cp zeek/zeek.crt /etc/filebeat/certs
sudo cp zeek/zeek.key /etc/filebeat/certs
sudo chmod 770 -R /etc/filebeat/certs
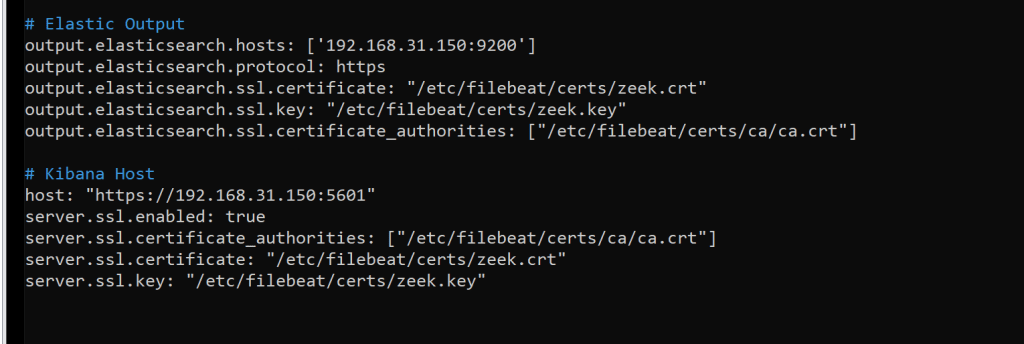
sudo nano /etc/filebeat/filebeat.yml
# Elastic Output
output.elasticsearch.hosts: [‘192.168.31.150:9200’]
output.elasticsearch.protocol: https
output.elasticsearch.ssl.certificate: “/etc/filebeat/certs/zeek.crt”
output.elasticsearch.ssl.key: “/etc/filebeat/certs/zeek.key”
output.elasticsearch.ssl.certificate_authorities: [“/etc/filebeat/certs/ca/ca.crt”]
# Kibana Host
host: “https://192.168.31.150:5601“
server.ssl.enabled: true
server.ssl.certificate_authorities: [“/etc/filebeat/certs/ca/ca.crt”]
server.ssl.certificate: “/etc/filebeat/certs/zeek.crt”
server.ssl.key: “/etc/filebeat/certs/zeek.key”
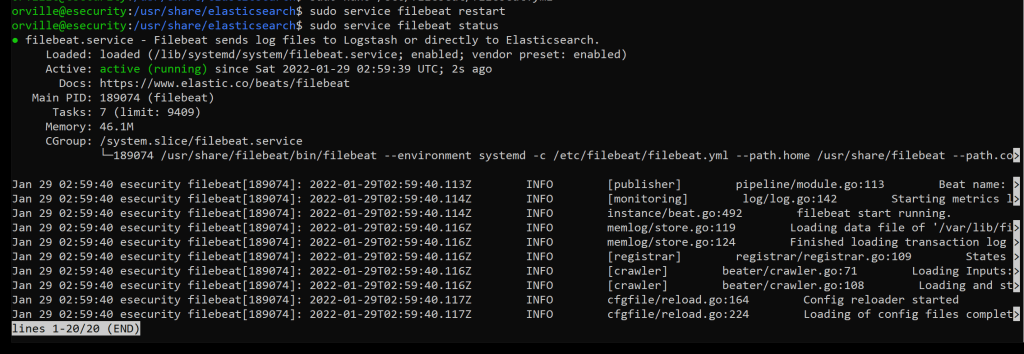
sudo service filebeat restart
sudo service filebeat status
sudo filebeat test output

Take a snapshot
Adding Authentication
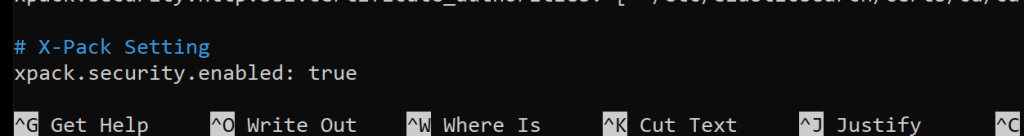
sudo nano /etc/elasticsearch/elasticsearch.yml
# X-Pack Setting
xpack.security.enabled: true
sudo service elasticsearch restart
sudo service elasticsearch status
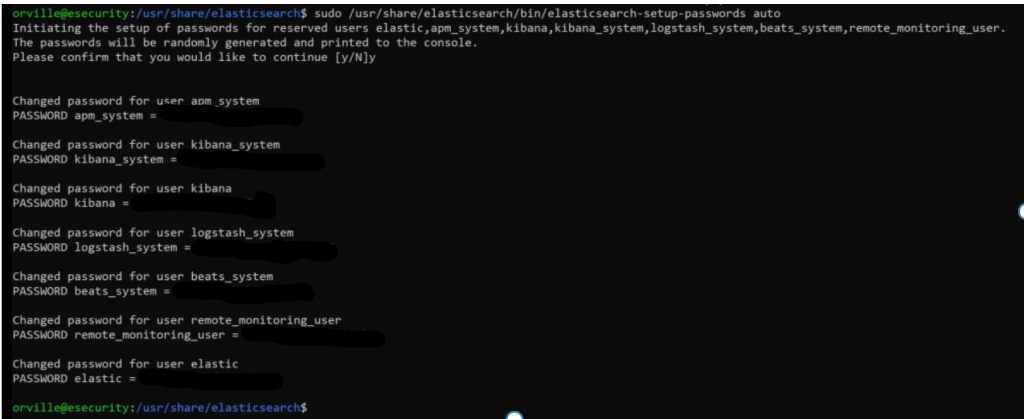
sudo /usr/share/elasticsearch/bin/elasticsearch-setup-passwords auto

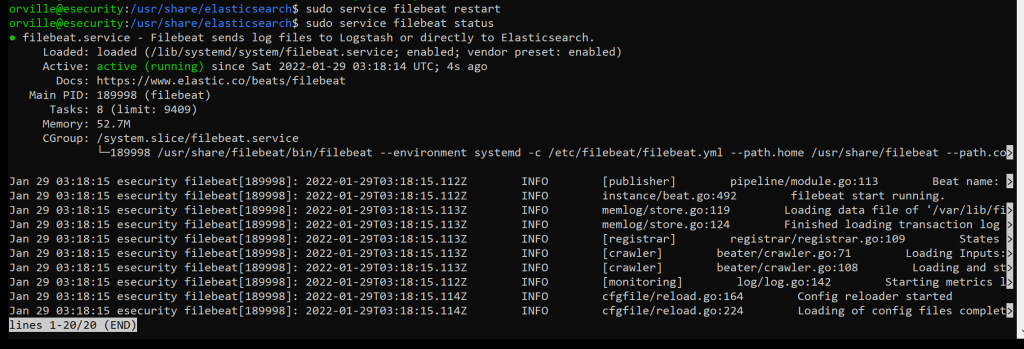
sudo service filebeat restart
sudo service filebeat status
sudo nano /etc/kibana/kibana.yml

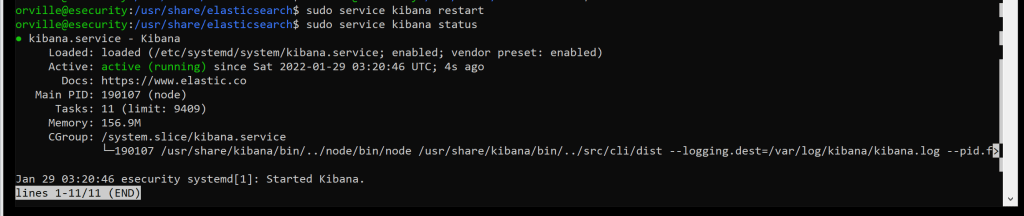
sudo service kibana restart
sudo service kibana status
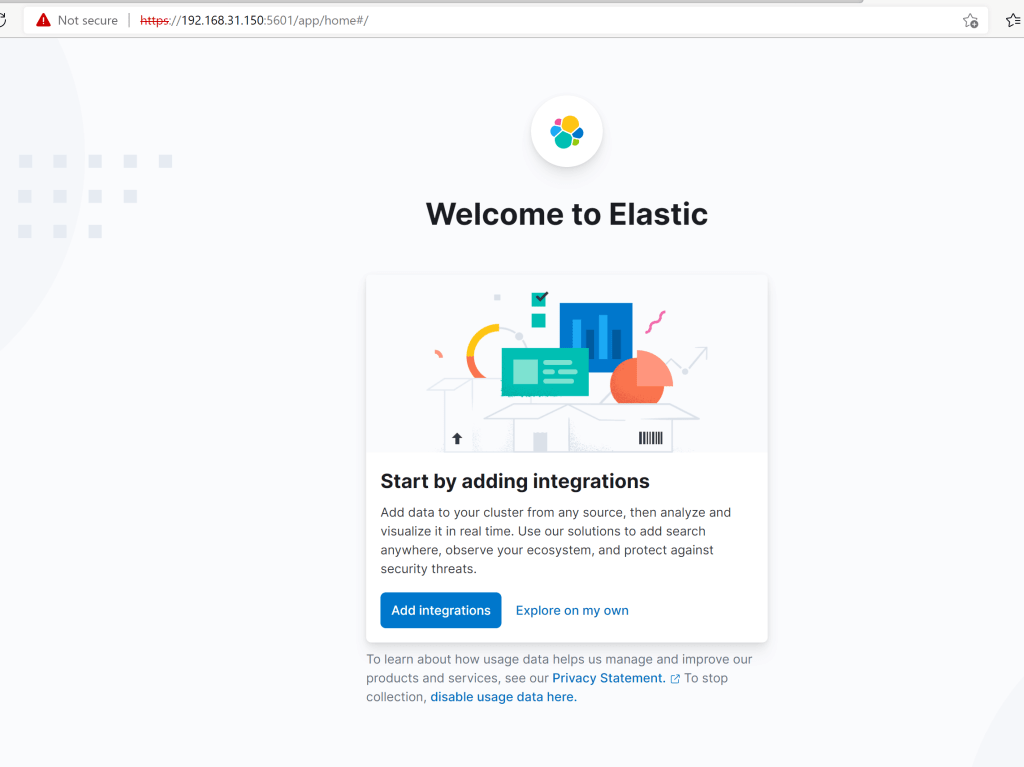
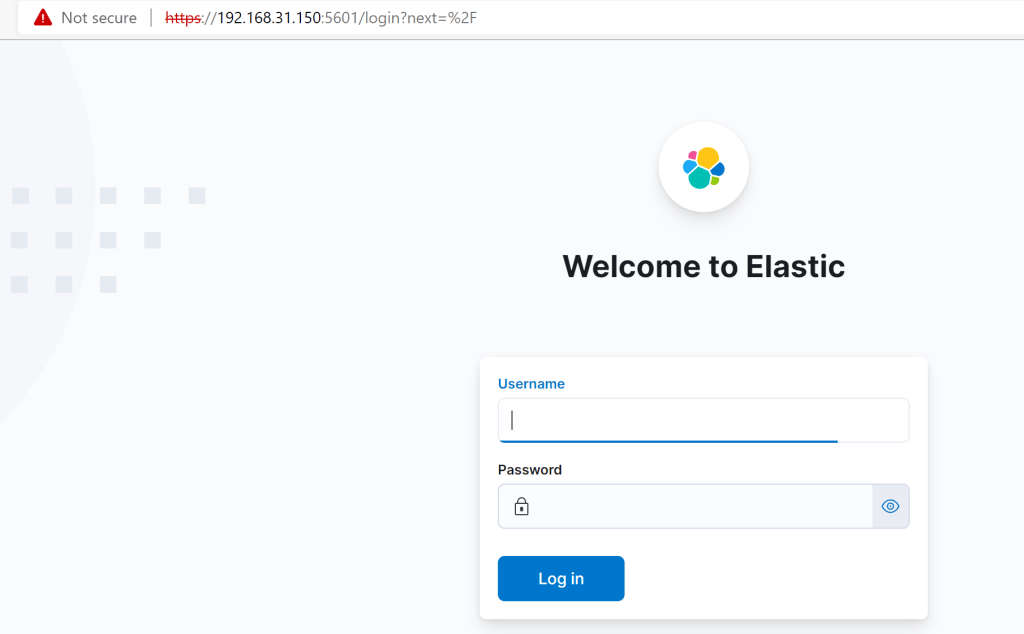
There should be a login prompt now
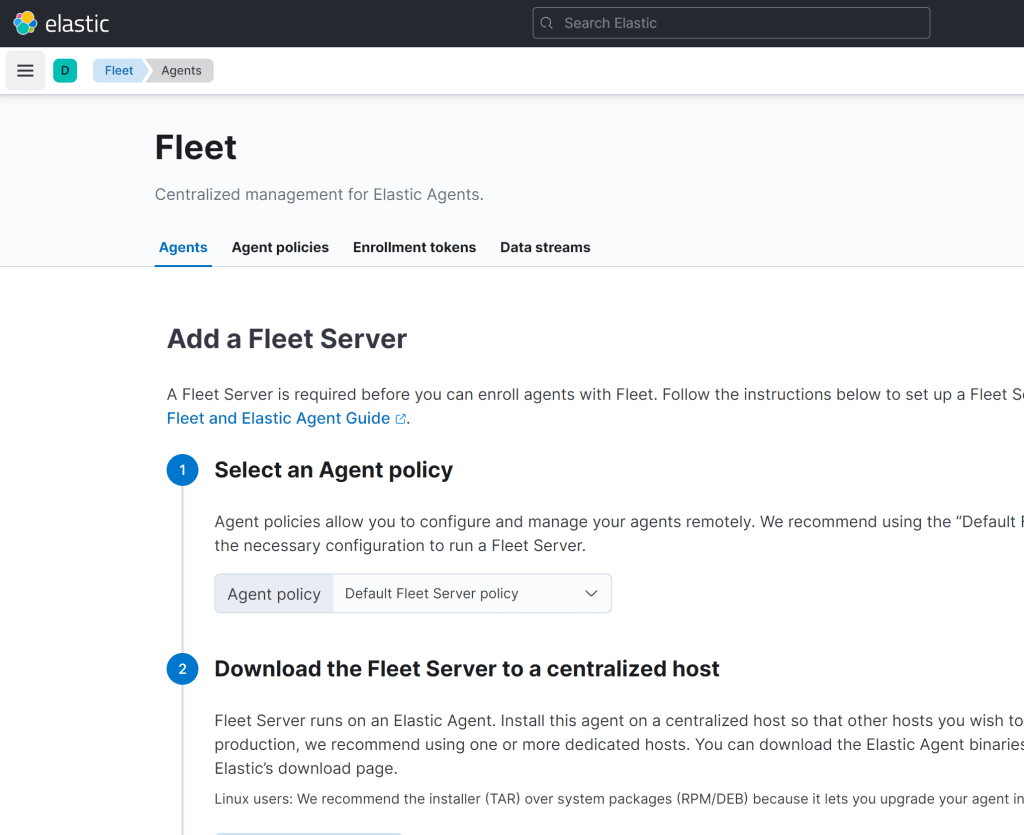
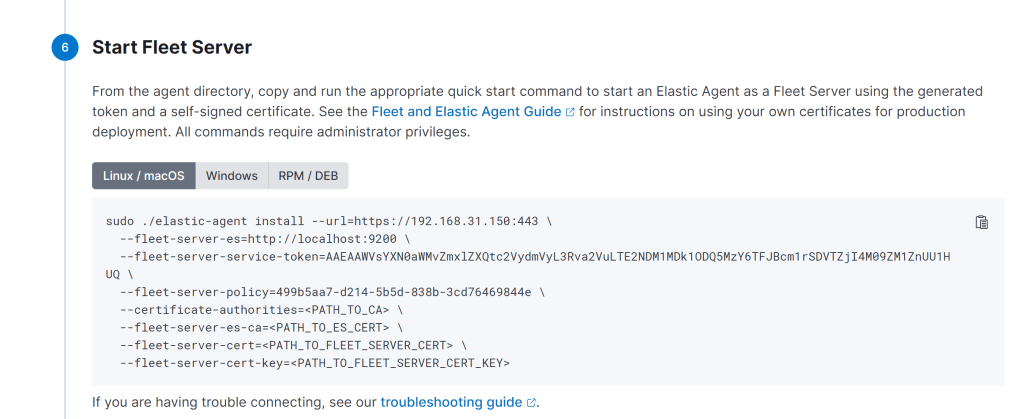
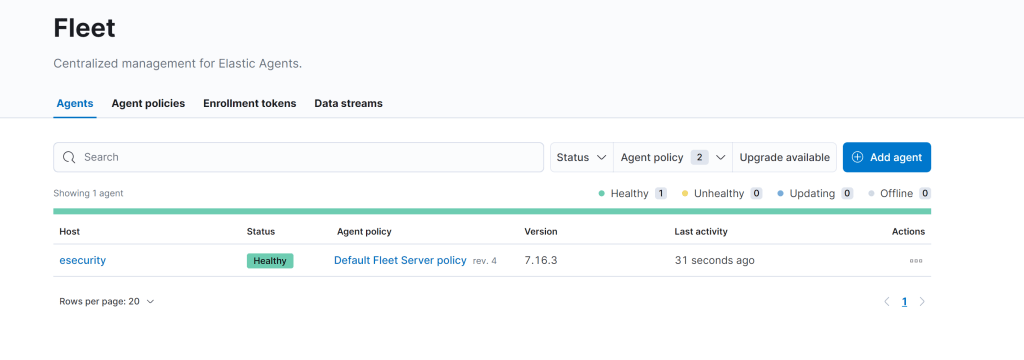
Installing the Elastic Alert EDR Agent
Navigate to the “Fleet” dashboard.
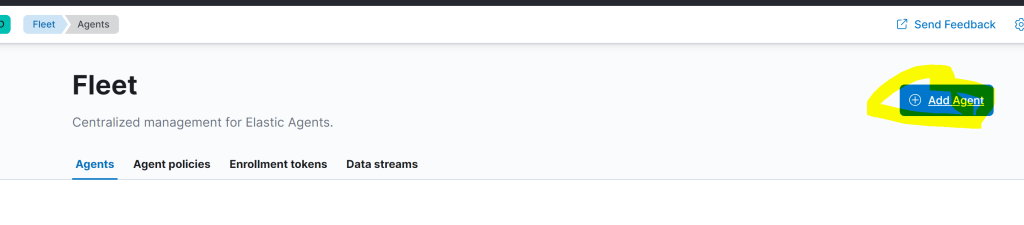
From the fleet management menu, click “add agent”. .
download the agent and untar it
Install Fleet-managed Elastic Agents | Fleet and Elastic Agent Guide [7.16] | Elastic
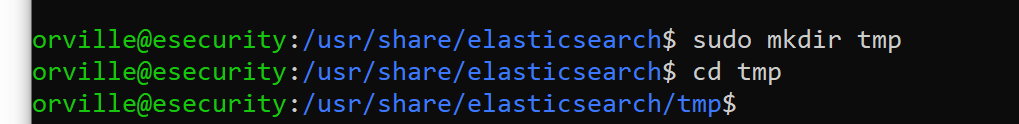
sudo mkdir tmp
cd tmp
sudo curl -L -O https://artifacts.elastic.co/downloads/beats/elastic-agent/elastic-agent-7.16.3-linux-x86_64.tar.gz

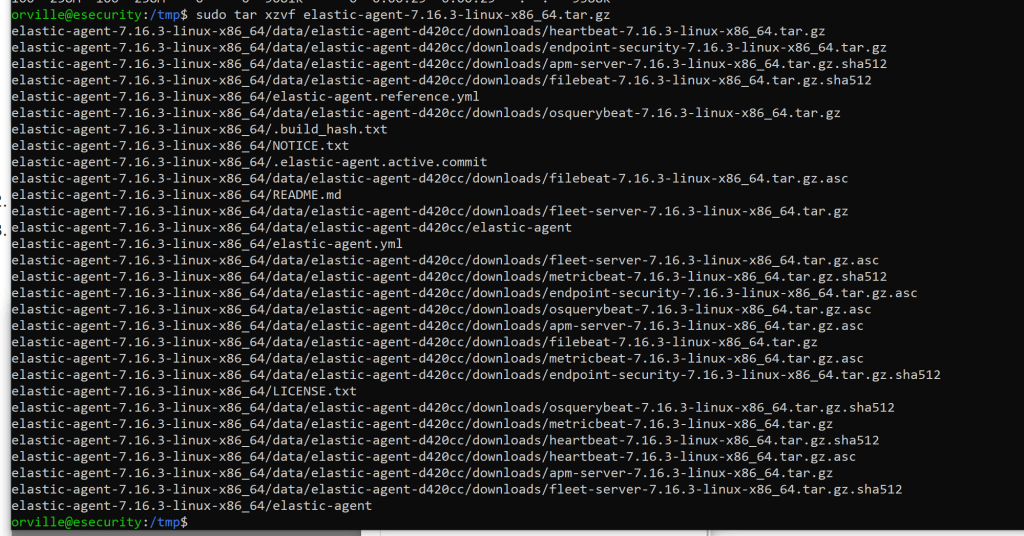
sudo tar xzvf elastic-agent-7.16.3-linux-x86_64.tar.gz

sudo ./elastic-agent install –url=https://192.168.31.150:8220 –fleet-server-es=https://192.168.31.150:9200 –fleet-server-service-token=AAEAAWVsYXN0aWMvZmxlZXQtc2VydmVyL3Rva2VuLTE2NDM2ODI3ODYwOTc6SFpsU05saUhRcUdFb2NZenJqbU5KUQ –fleet-server-policy=499b5aa7-d214-5b5d-838b-3cd76469844e –certificate-authorities=/etc/elasticsearch/certs/ca/ca.crt –fleet-server-es-ca=/etc/elasticsearch/certs/ca/ca.crt –fleet-server-cert=/etc/elasticsearch/certs/elasticsearch.crt –fleet-server-cert-key=/etc/elasticsearch/certs/elasticsearch.key
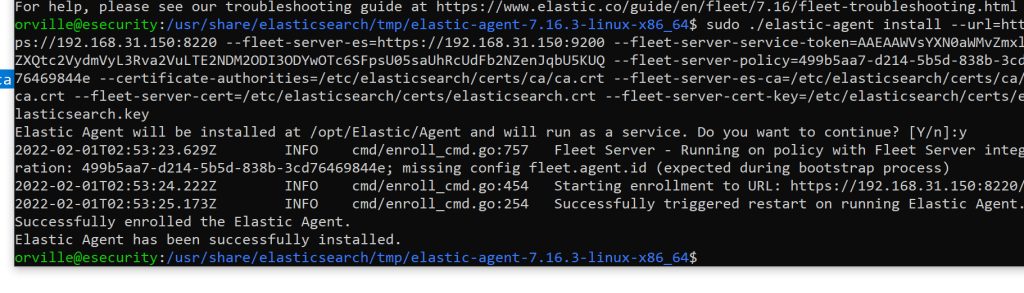
If you get the below it is working.

Hit continue
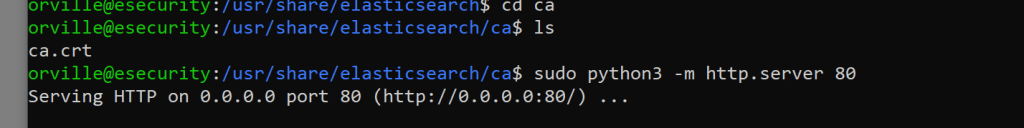
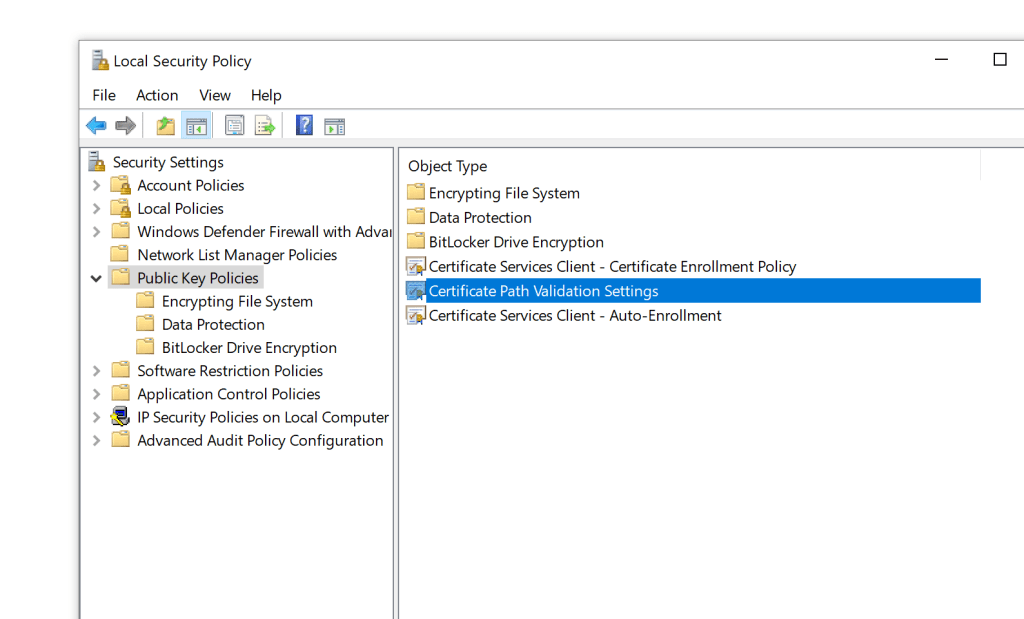
Copy the ca.crt file to the windows machine and open the local security policy and make the below changes.

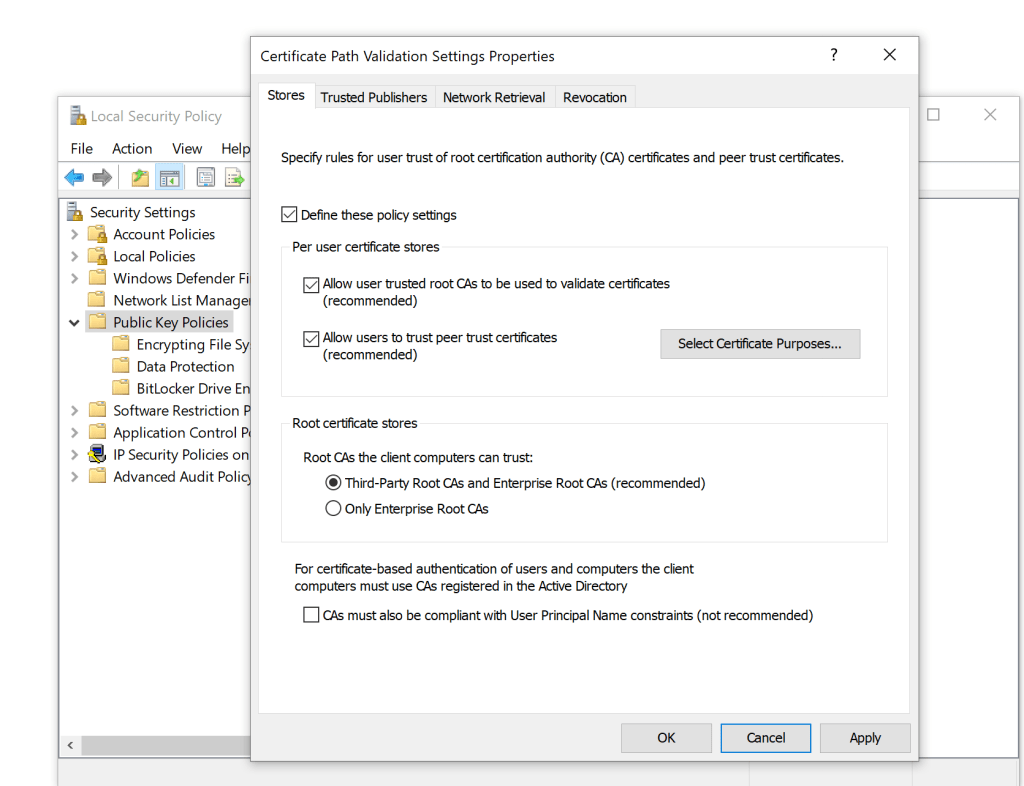
click ok
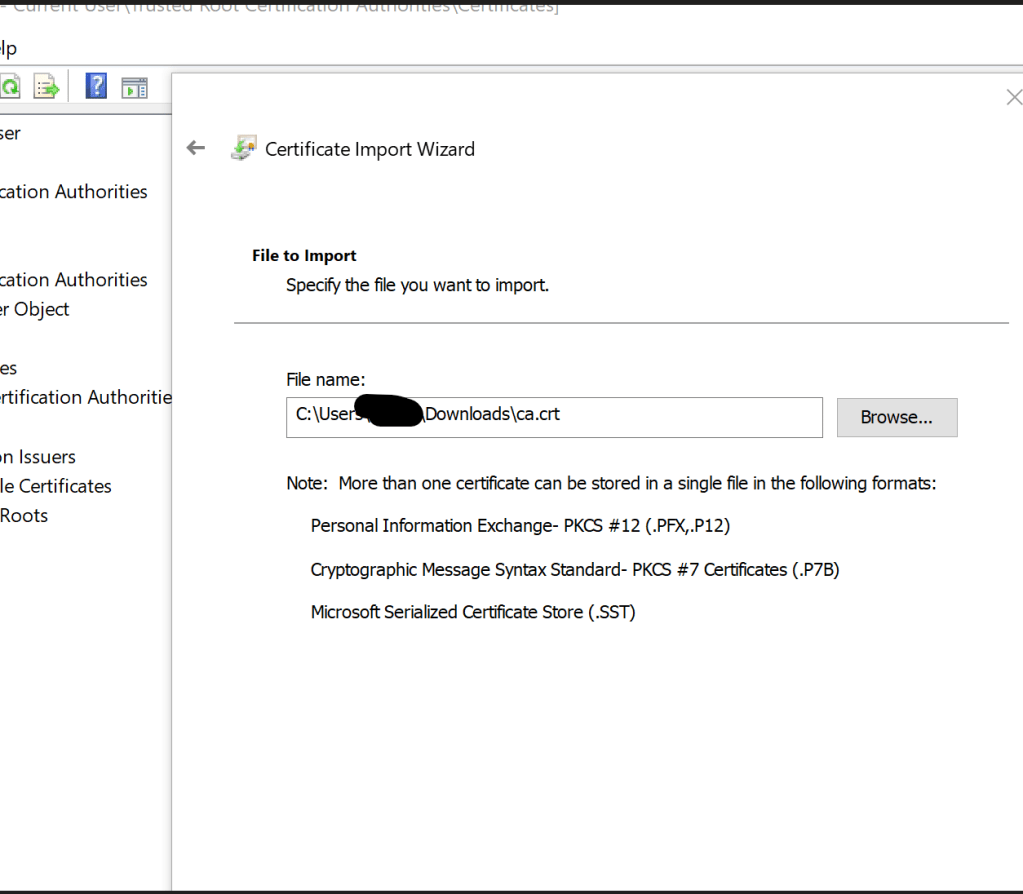
Opencertmgr.msc
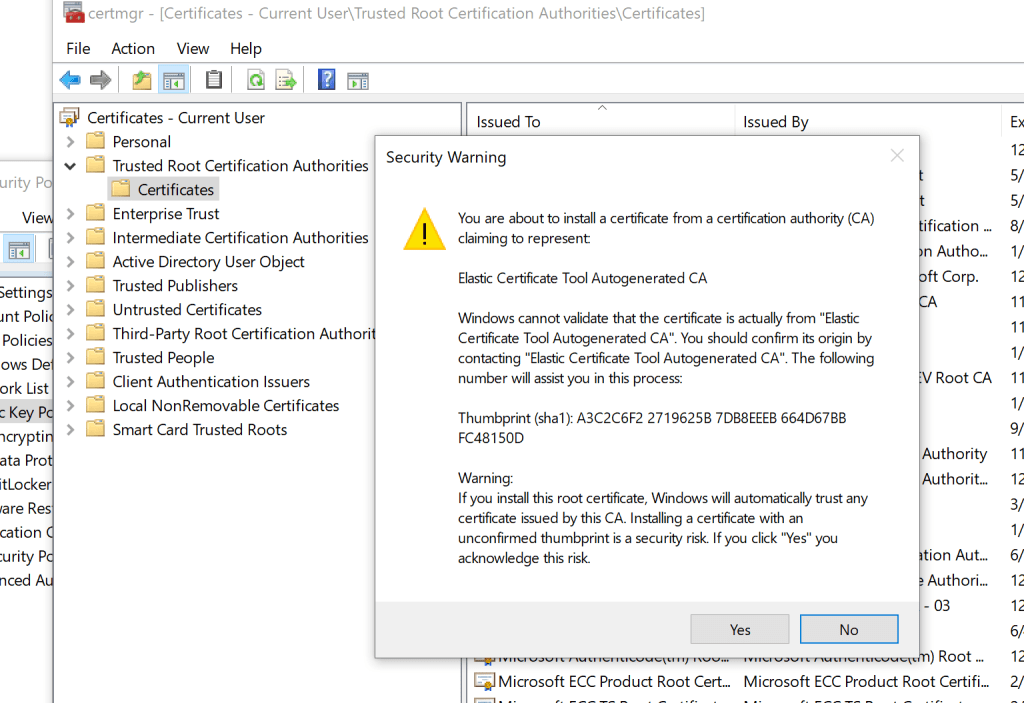
Go to Trusted Root Certification Authorities > Certificates. Select All Tasks > Import
Use the ca.crt file that was copied to the machine.
Add the agent.
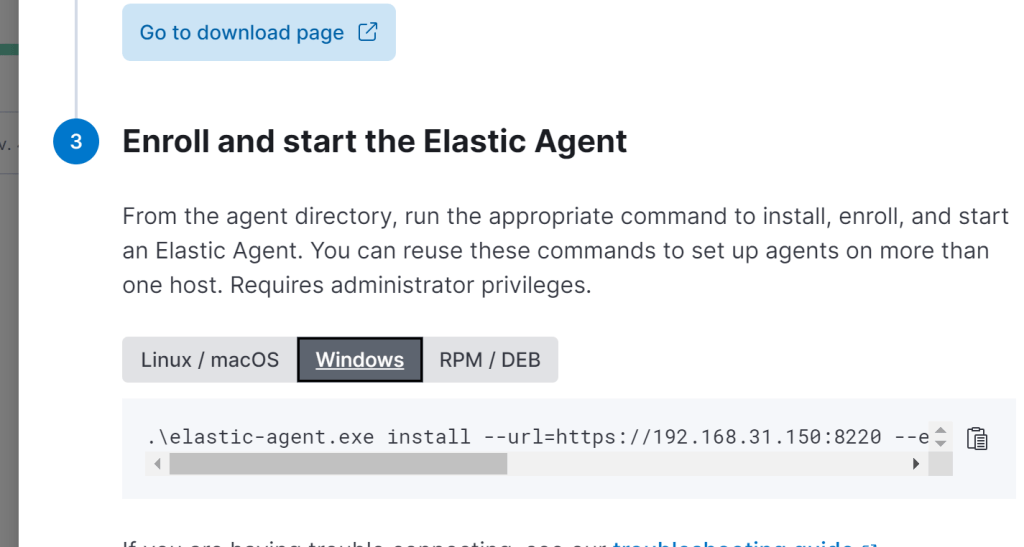
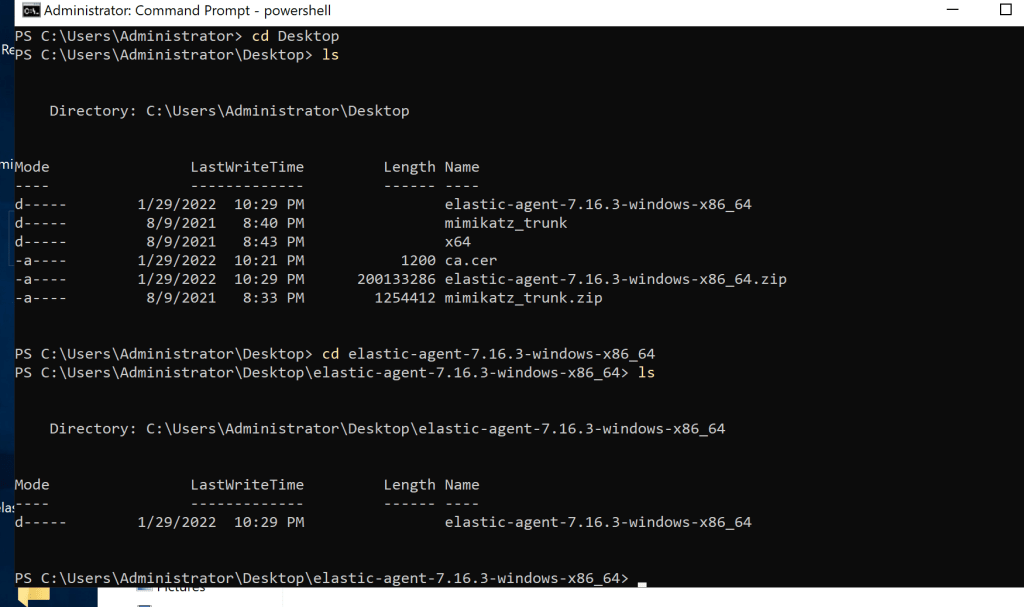
Download and unzip the agent on the windows host. Open PowerShell as admin and change to the folder the agent is in.
.\elastic-agent.exe install –url=https://192.168.31.150:8220 –enrollment-token=RzhQcW8zNEJDTXdoTmZhcHdEUnE6eGUzUjFSUnhSTy13Rmk1b3IxdUZPQQ==
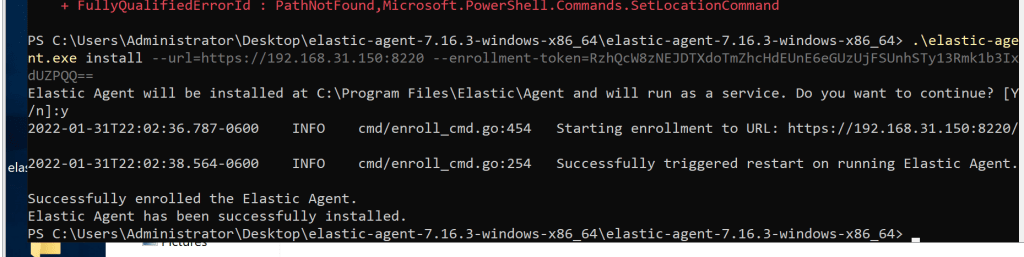
Now you should see the new agent.

In Kibana, go to Security-> Endpoints
Click Add Endpoint Security button
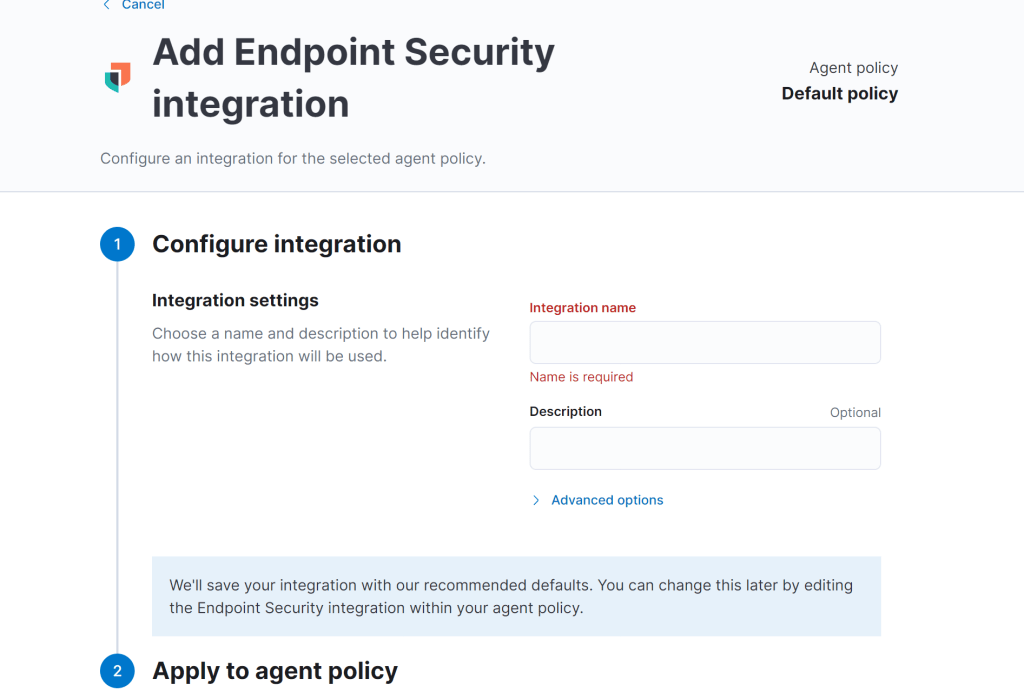
Start configuring the Endpoint Security Integration. Name the Integration whatever you want (e.g., secure). Select Default Fleet Server policy -> Save Integration -> Save and Deploy Changes.
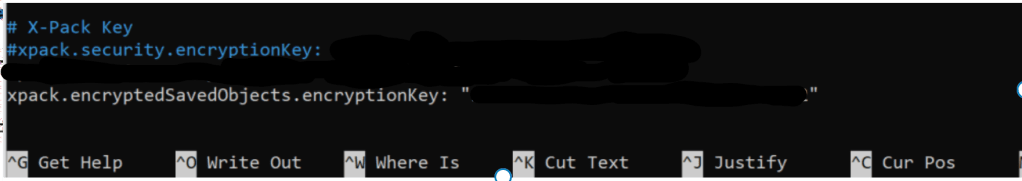
Adding Detections
I also had to add these detections that was mentioned in the site I was following. It can be any 32 bit key.
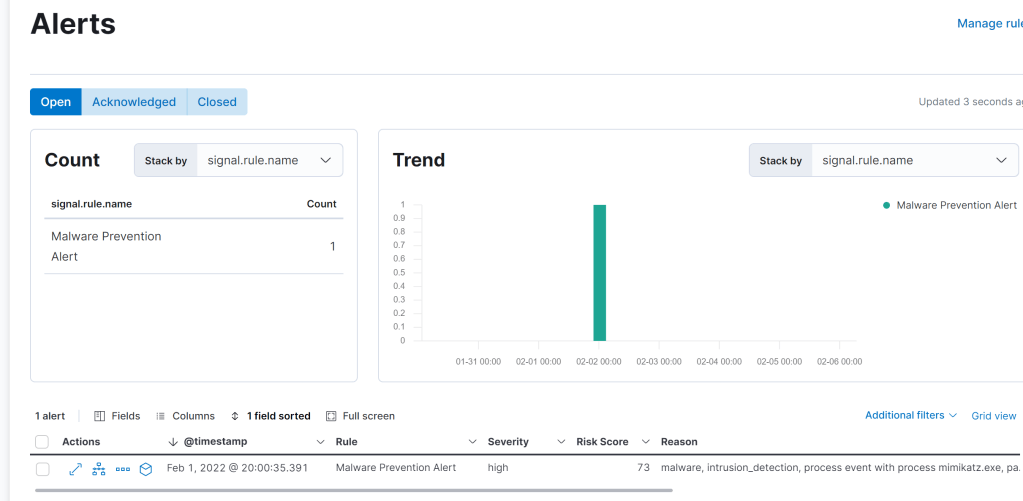
Testing it
I ran Mimikatz on the server I installed the agent on and got an alert.
Site I used to help me.
